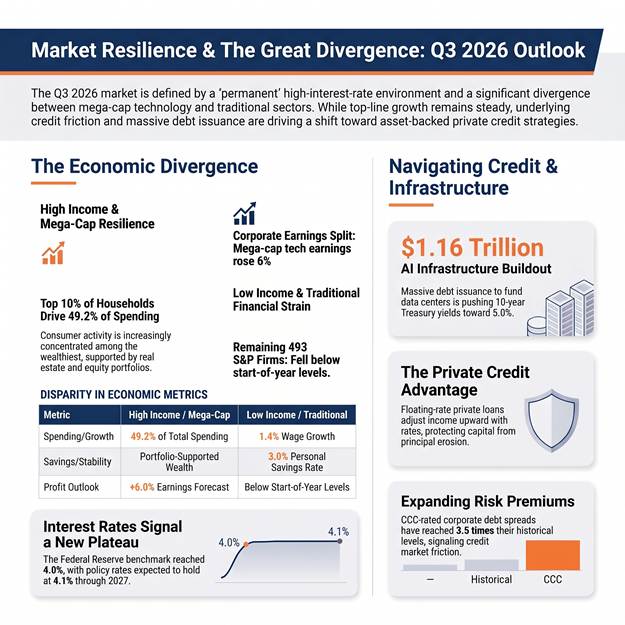
| The Quick Take… Q3 2026 confirmed that elevated interest rates are here to stay. In September, the Federal Reserve raised its benchmark rate to 3.75%–4.00%, signaling rates around 4.1% through 2027. Underneath resilient top-line figures, economic growth is highly split: affluent consumers and mega-cap tech drive activity, while traditional businesses absorb tighter conditions. Tech leaders are issuing record debt for AI infrastructure, pushing 10-year Treasury yields toward 5.0%. Broad equity and bond funds leave capital vulnerable to rate swings and heavy debt issuance. Allocating to asset-backed private credit and structured risk offers a grounded way to harvest yield while protecting core capital. |
The Lead
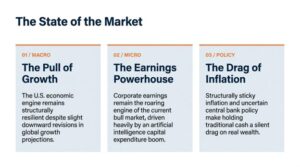
Surface headlines throughout the third quarter painted a picture of steady economic momentum. Second-quarter economic growth was revised upward to 2.2%, while real-time third-quarter estimates tracked near a 3.7% annualized pace. Look closer at the mechanics, however, and the forces supporting this economy are remarkably narrow.
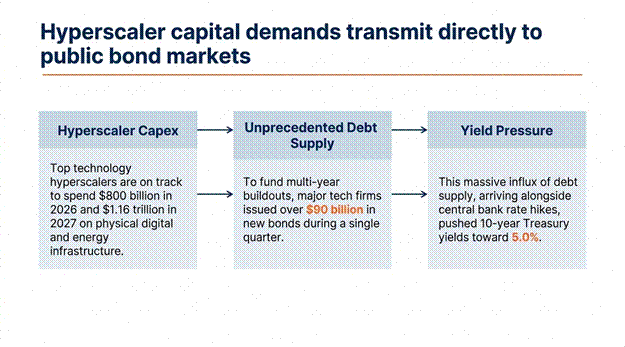
The Federal Reserve ended its rate pause in September, raising benchmark rates to 3.75% to 4.00% as central bankers acknowledged that price pressures remain stubborn. Concurrently, major technology firms issued over $90 billion in new bonds during a single quarter to construct data centers and energy infrastructure. This wave of debt supply pushed 10-year Treasury yields toward 5.0%, fundamentally changing the return math across traditional stock and bond portfolios.
The Core Analysis
Divergence Across Consumers and Corporations
The third quarter highlighted a deepening economic split across income brackets and business sectors. The wealthiest 10% of households now generate 49.2% of total U.S. consumer spending, supported by expanding equity and real estate portfolios. Conversely, lower-income wage growth slowed to 1.4%, while personal savings rates dropped to 3.0%.
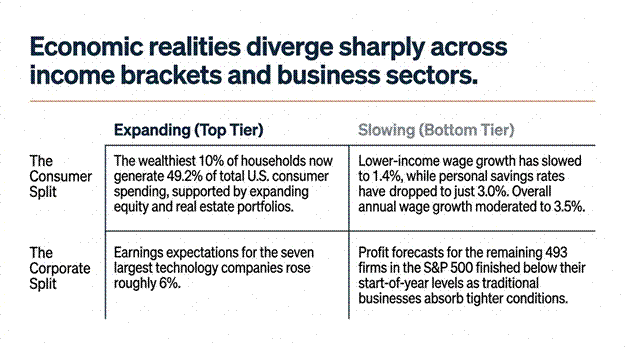
A similar divide defines corporate earnings. Earnings expectations for the seven largest technology companies rose roughly 6%, whereas profit forecasts for the remaining 493 firms in the S&P finished below their start-of-year levels. Overall labor data reflected moderate slowing, with June payrolls adding 57,000 jobs alongside downward revisions to prior months, unemployment stabilizing at 4.2%, and annual wage growth moderating to 3.5%.
Heavy Debt Supply and Credit Market Friction
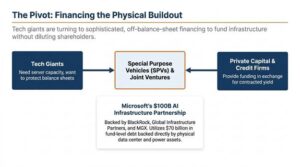
Constructing physical digital infrastructure requires unprecedented capital. Top technology hyperscalers – large cloud service providers – are on track to spend $800 billion in 2026 and $1.16 trillion in 2027. To fund these multi-year buildouts, firms are borrowing heavily through public corporate bond markets.
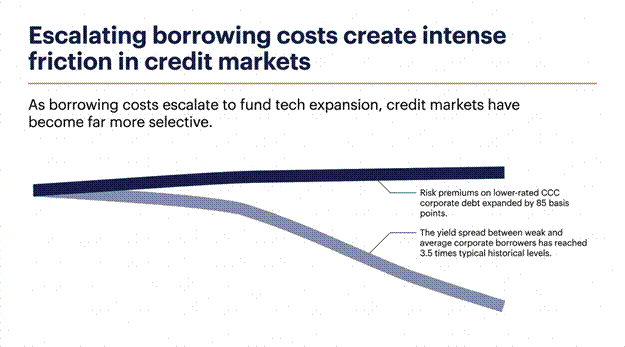
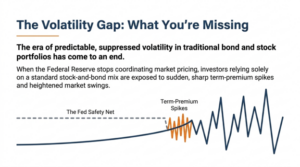
As borrowing costs escalated, credit markets became far more selective. Risk premiums on lower-rated CCC corporate debt expanded by 85 basis points, driving the yield spread between weak and average corporate borrowers to 3.5 times typical historical levels. Traditional fixed income benchmarks, heavily weighted in fixed-rate paper, offer little protection against this ongoing supply pressure.
What You’re Missing
Insulation and Uncorrelated Yield Through Private Credit
Traditional stock and bond allocations face structural headwinds from persistent interest rate swings and heavy corporate debt issuance. Holding broad, fixed-rate bond funds exposes capital to principal erosion every time long-term Treasury yields reprice higher.
Institutional managers are adapting by shifting capital toward asset-backed private credit, direct lending, and structured risk overlays.
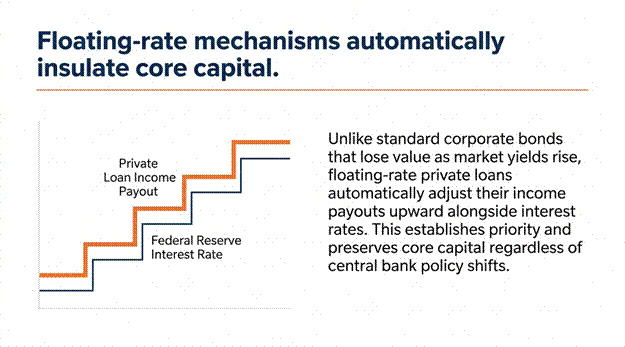
Unlike standard corporate bonds that lose value as market yields rise, floating-rate private loans automatically adjust their income payouts upward alongside interest rates. Furthermore, directly negotiated private credit agreements are secured by real physical assets and business cash flows, establishing priority over public bondholders. Sourcing income from asset-backed private loans allows investors to capture attractive yields while insulating principal values from public market rate volatility.
This Caught My Eye
I spent time reviewing Barclays’ research on physical AI hardware, which reframes where long-term investment returns will accumulate. While financial headlines remain fixated on software algorithms and phone apps, capital is pivoting toward physical supply chains. Barclays projects the global humanoid robot market to surge from $2 billion to $3 billion today to a base case of $40 billion, with upside scenarios reaching $200 billion by 2035. This trajectory is enabled by a 30-fold drop in unit manufacturing costs over the last decade.
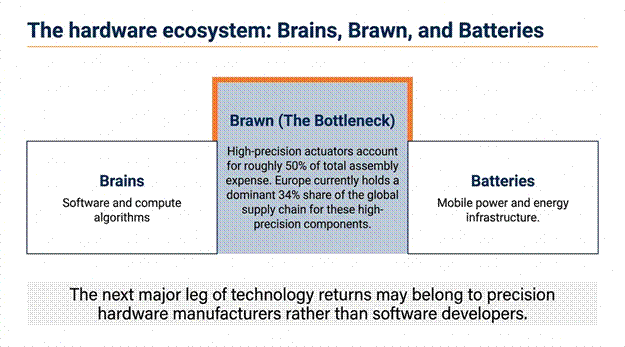
The report breaks the hardware ecosystem down into brains, brawn, and batteries. The primary cost bottleneck sits in brawn, where high-precision actuators account for roughly 50% of total assembly expense. While China leads in sheer deployment volume, Europe holds a 34% share of the global supply chain for high-precision components. It is a thought-provoking reminder that the next major leg of technology returns may belong to precision hardware manufacturers rather than software developers.
| Ready to learn more? Next Step: Contact us for information on the private credit strategies available through Halbert Wealth Management. |
Infographic Summary
Halbert Wealth Management is an SEC-registered investment advisor. Investments in alternative strategies are speculative, involve substantial risk of loss, and are not suitable for all investors. Past performance does not guarantee future results.

Spencer Wright is the Executive Vice President of Halbert Wealth Management, Inc. and the author of Forecasts & Trends. He has been with HWM for over 25 years.